Barchart Matrix implemented with d3
Consider the following dataset stored as a table with 6 columns.
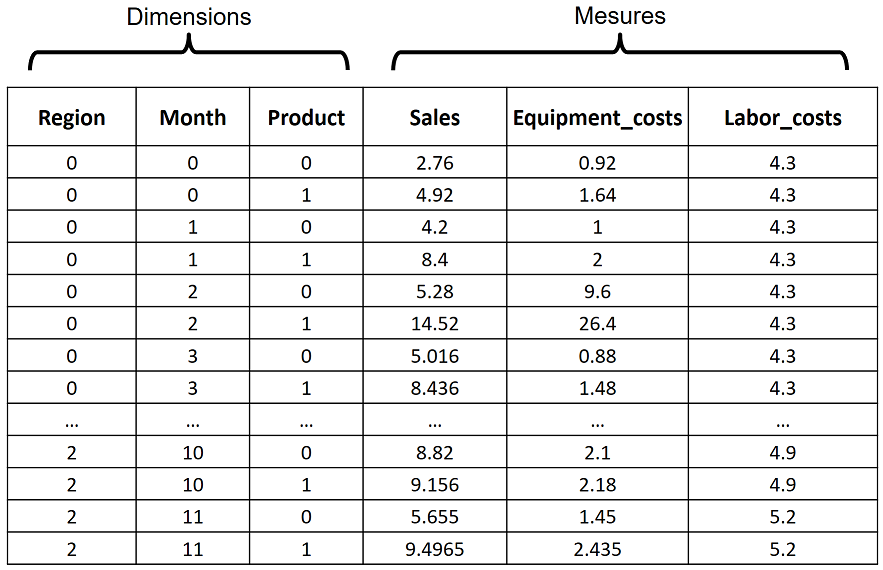
The first 3 columns in the table are dimensions (independent, categorical variables),
and the other 3 columns are measures (dependent, quantitative variables).
The measures are functions of the dimensions.
Each combination of the values of the dimensions occurs once.
Since there are 3 Regions, 12 Months, and 2 Products,
there are 3x12x2 = 72 rows.
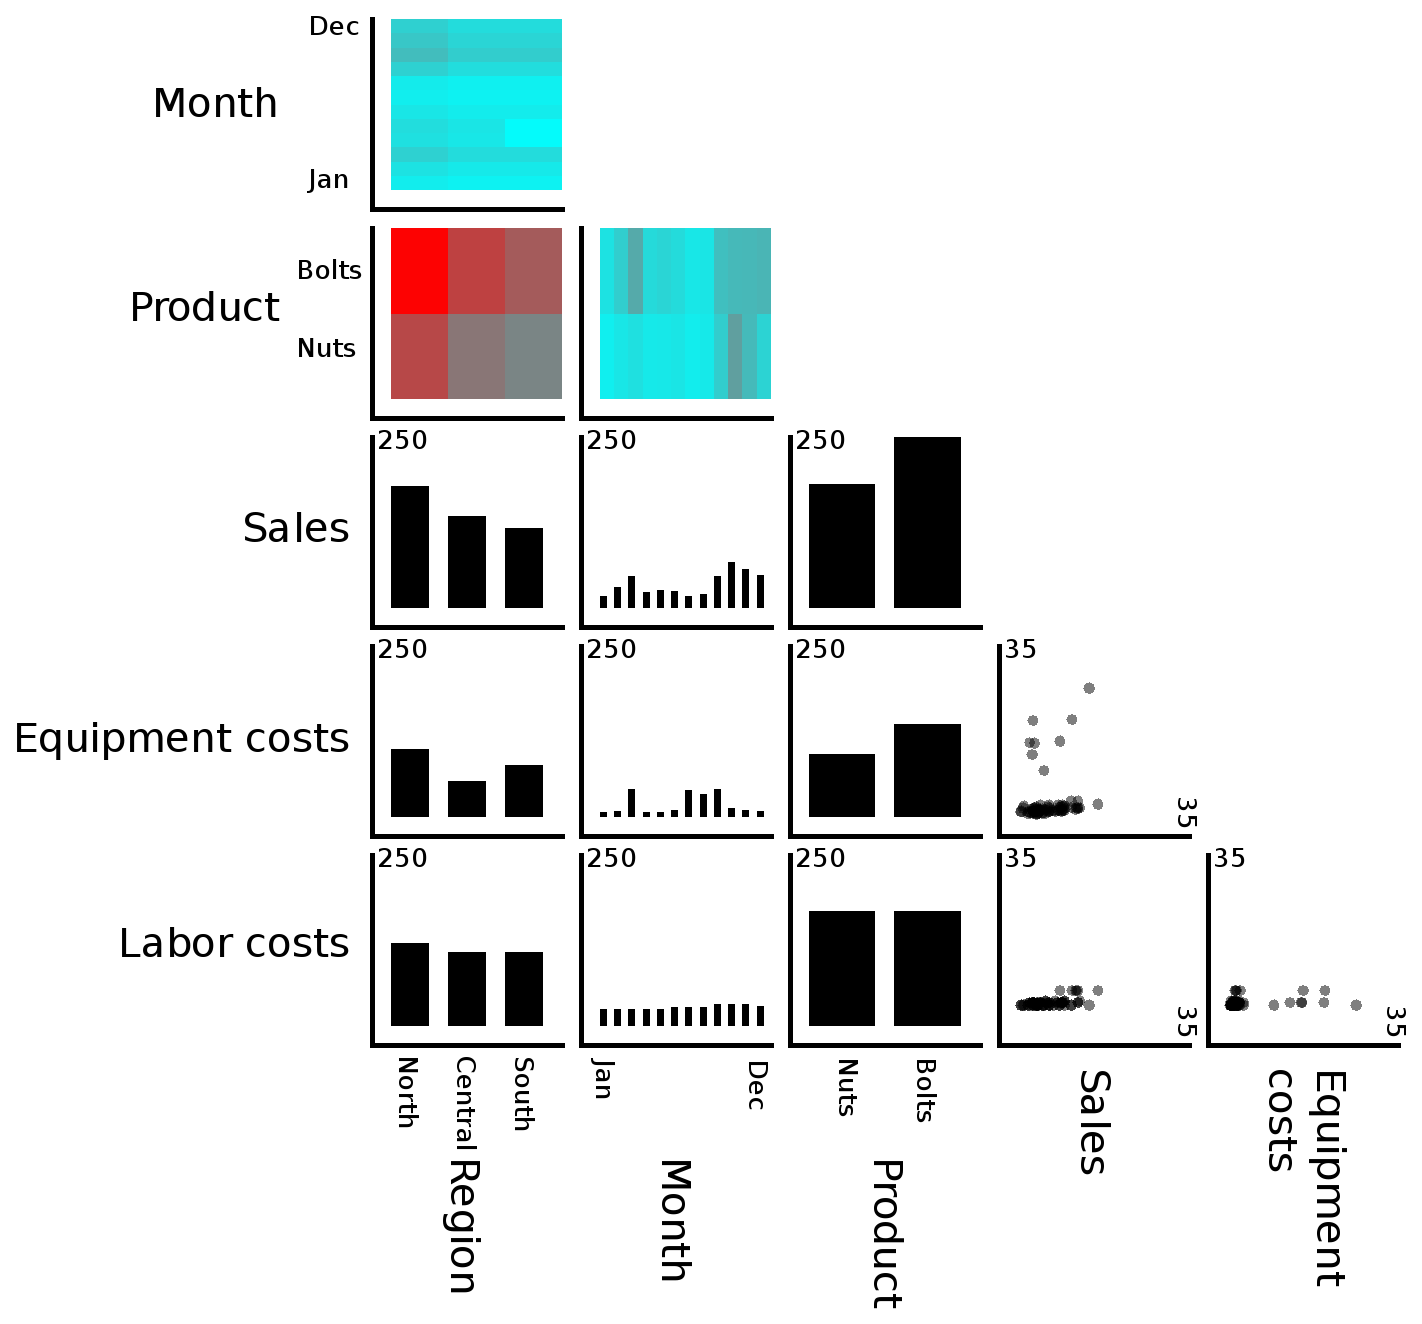
The Barchart Matrix below provides an overview of the data in the table.
The 3 dimensions are crossed with the 3 measures to produce a matrix,
with each cell showing one measure as a function of one dimension.
(For d3 source code, view the source of this webpage.)
Other Matrix-based Visualizations
Other visualizations that use a matrix of charts include
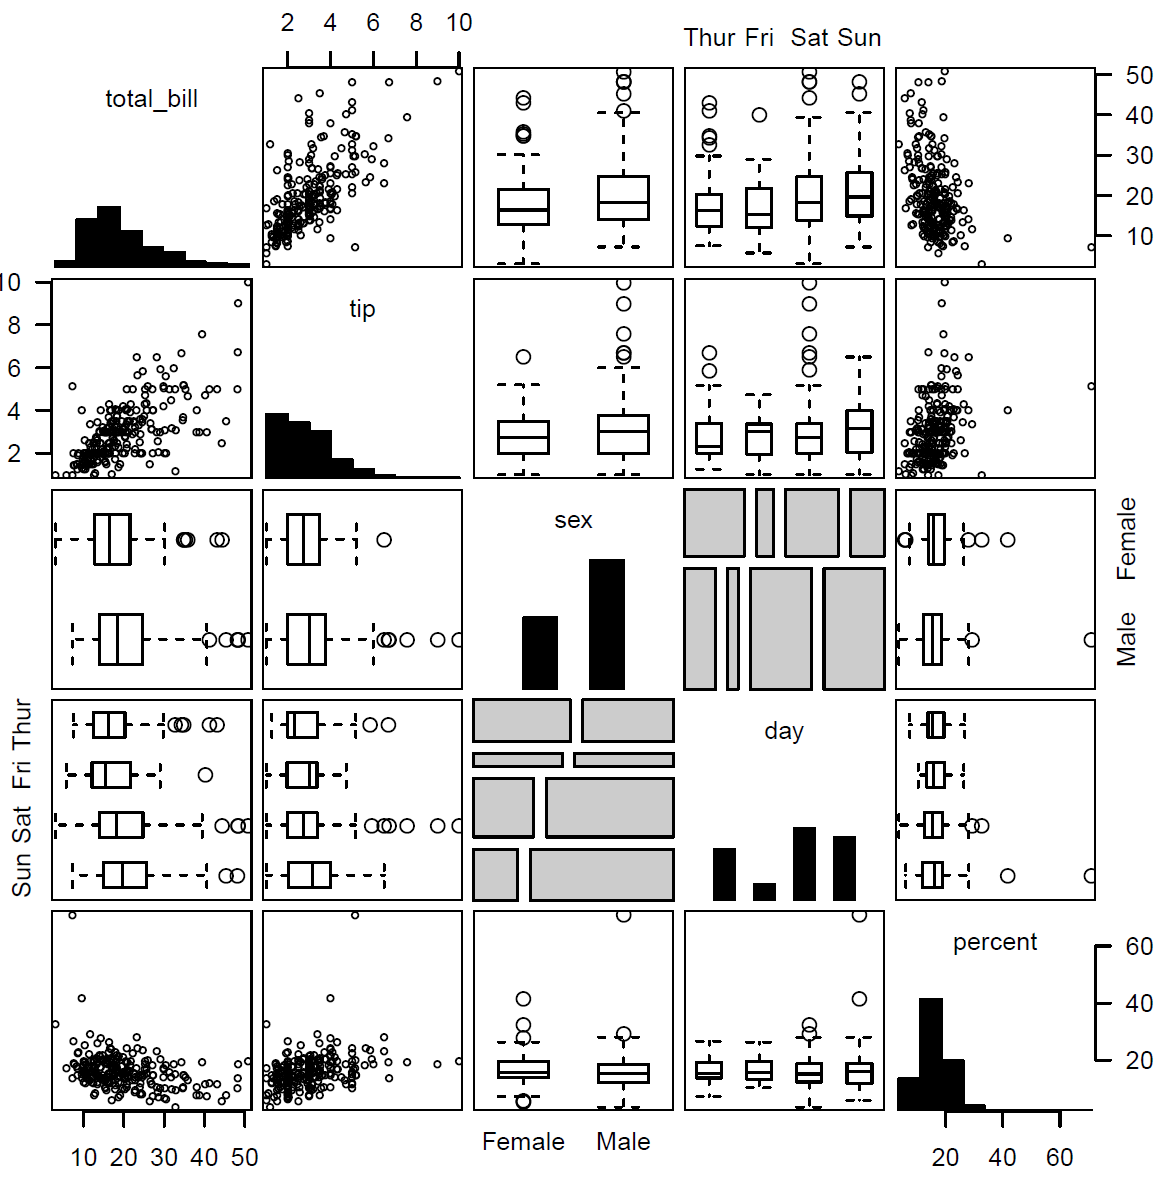
- The Generalized Pairs Plot / Generalized Plot Matrix (GPLOM): these techniques cross a set of both dimensions and measures with the
entire same set, and then display an appropriate chart within each cell of the resulting matrix.
- Emerson, John W., Walton A. Green, Barret Schloerke, Jason Crowley, Dianne Cook, Heike Hofmann, and Hadley Wickham (2013). "The generalized pairs plot". Journal of Computational and Graphical Statistics 22(1), pages 79-91.
http://scholar.google.ca/scholar?q=emerson+green+schloerke+crowley+cook+hofmann+wickham+%22generalized+pairs+plot%22
- Jean-François Im, Michael J. McGuffin, Rock Leung (2013). "GPLOM: The Generalized Plot Matrix for Visualizing Multidimensional Multivariate Data". IEEE Transactions on Visualization and Computer Graphics 19(12), pages 2606-2614.
http://profs.etsmtl.ca/mmcguffin/research/#im_infovis2013
- Michael Friendly (2014). "Comment on 'The Generalized Pairs Plot'".
Journal of Computational and Graphical Statistics 23(1), pages 290-291.
http://scholar.google.ca/scholar?q=friendly+comment+%22generalized+pairs+plot%22
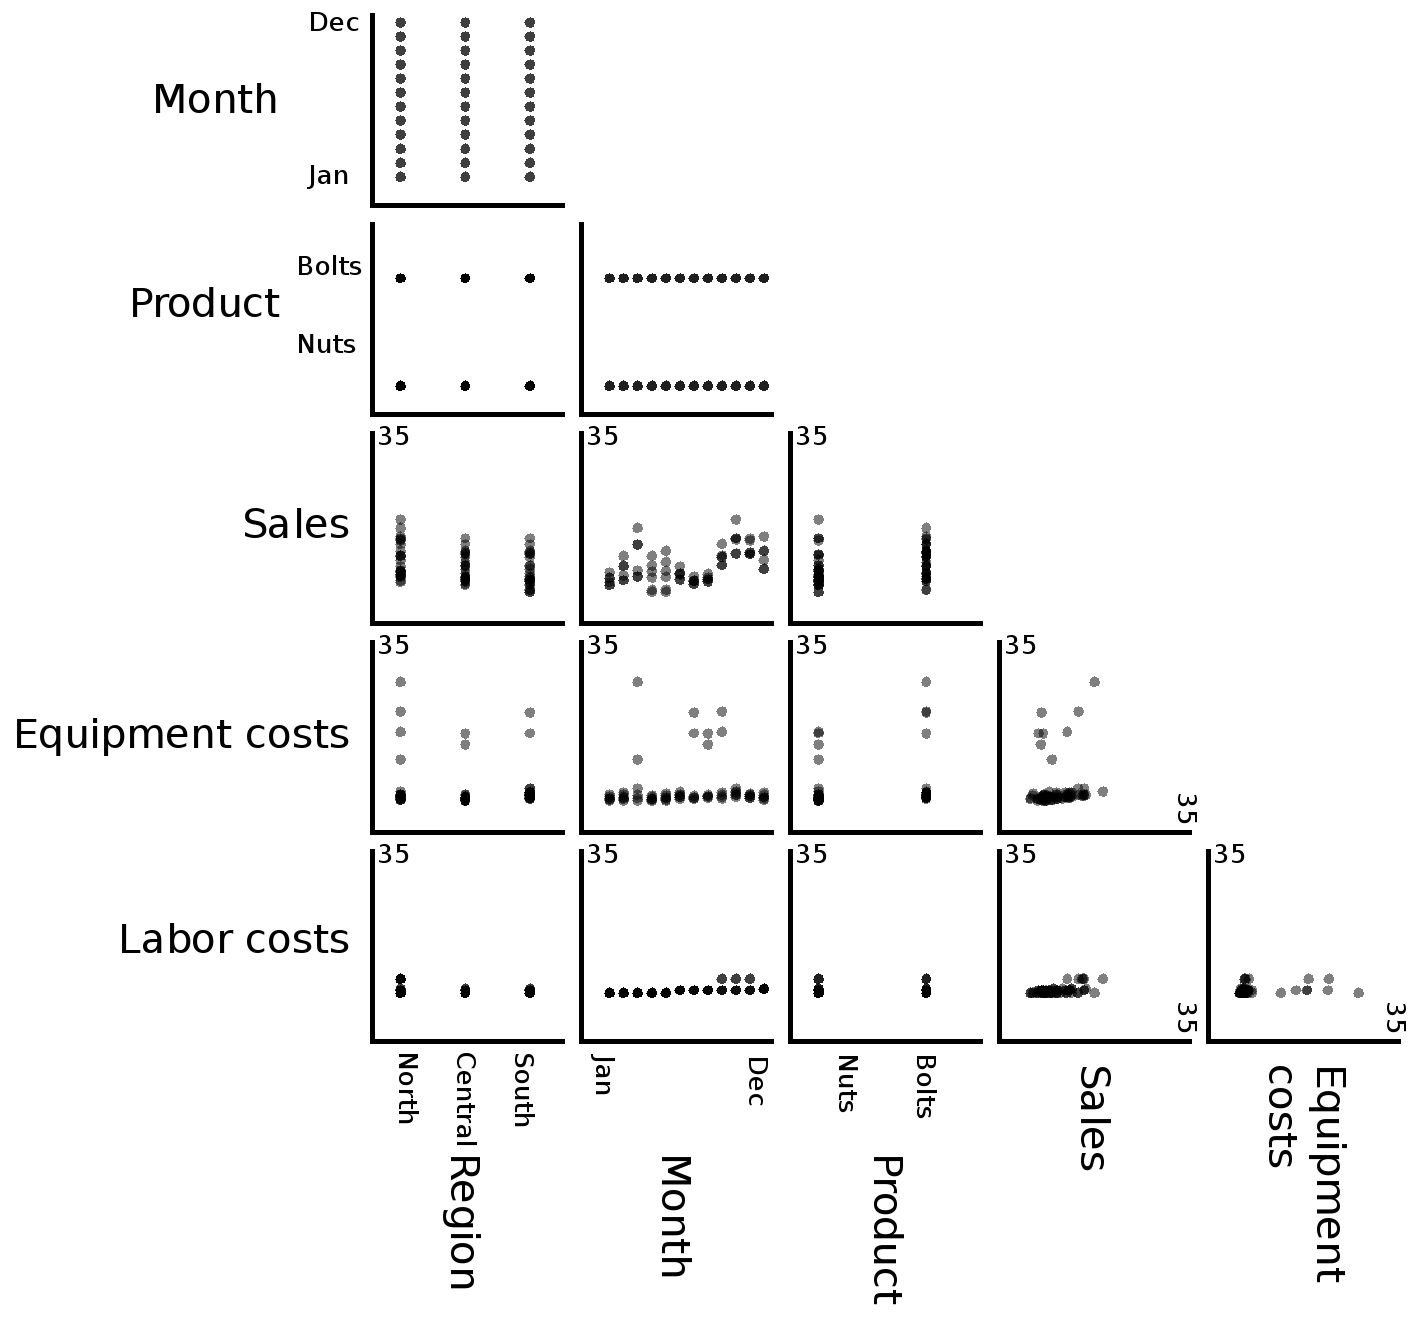
- The scatterplot matrix (SPLOM), which crosses a set of measures with themselves,
and displays a scatterplot in each cell of the matrix.
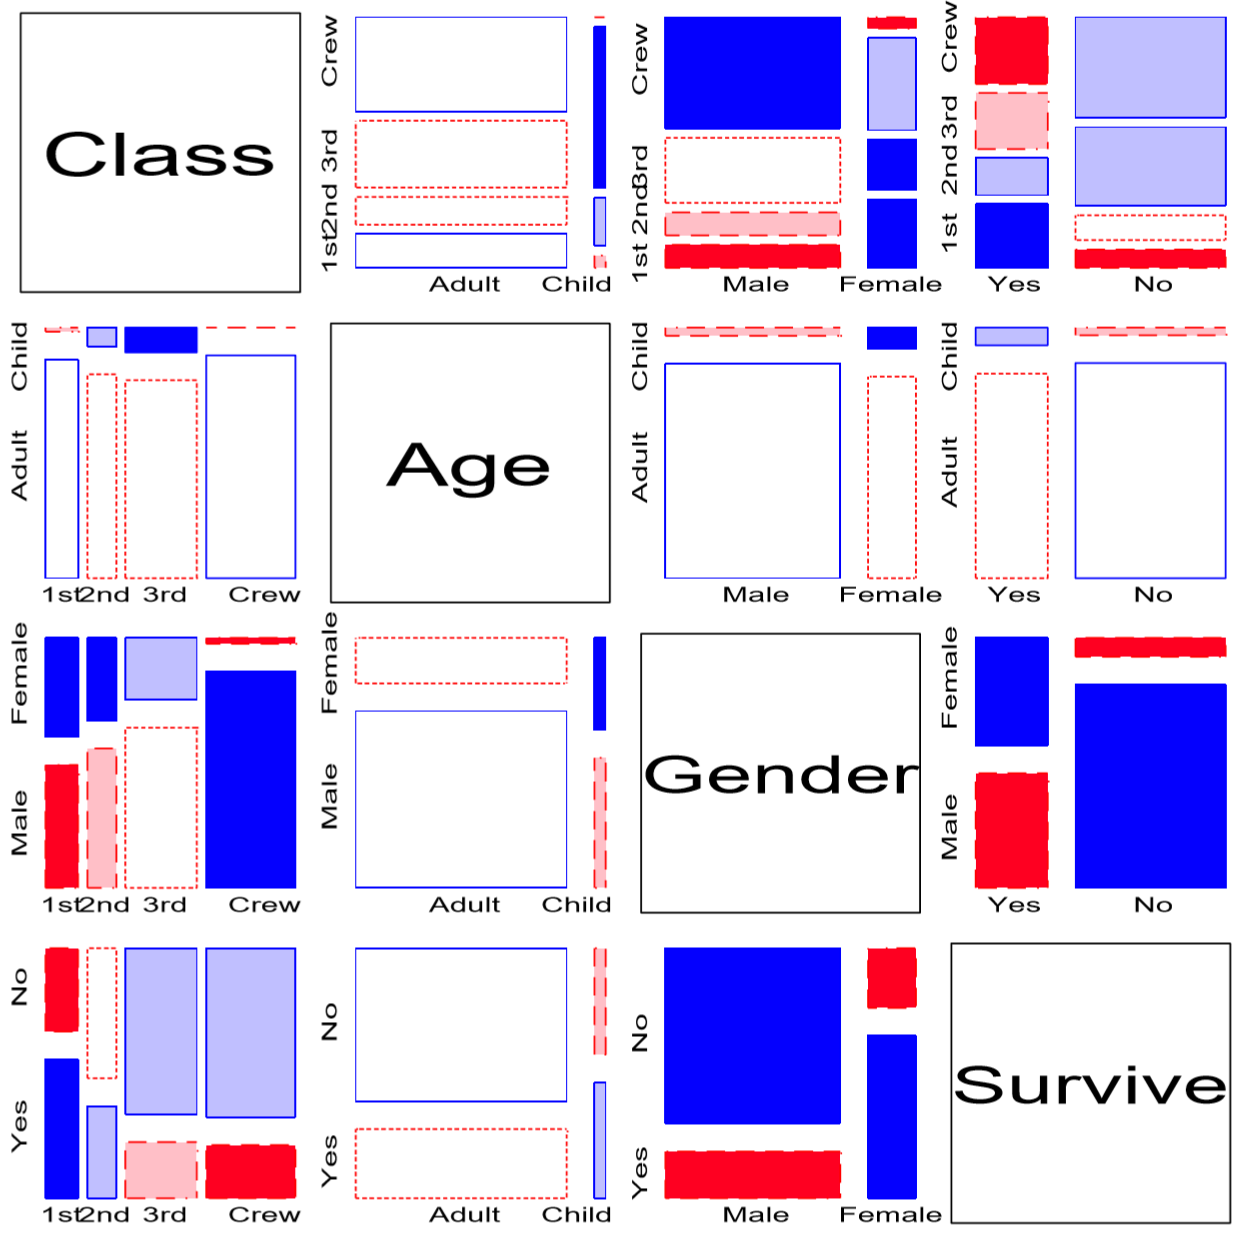
- The mosaic matrix, which crosses a set of dimensions with themselves,
and displays a mosaic chart in each cell of the matrix.