| 
| 
| 
|
Update (June 2004): many of the ideas in the below document have been revised and/or extended in a paper that has been accepted for publication at the Hypertext and Hypermedia 2004 conference. For a copy of that paper, which includes an updated version of Figure 18 below, see http://www.dgp.utoronto.ca/~mjmcguff/research/
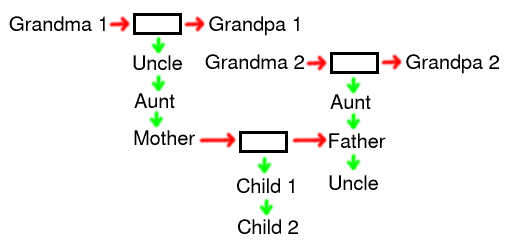
Zzstructure is the generic name for Ted Nelson's ZigZag(tm) [13,6,23,10], an unusual way of linking and organizing information. Zzstructures are one aspect of Nelson's vision of what hypertext should be (see, for example, Xanadu [11,12,5]). Many uses for zzstructures have been proposed, from organizing personal schedules [14], to visualizing genealogical family "trees" [26], to "cell programming" [22] (an example of a cellular programming language is Clang [25]).
As a data structure, Zzstructures allow nodes (or cells) of information to be linked into lists, cycles, grids (i.e. spreadsheet-like tables), trees, or all of these things simultaneously. There are also interesting visualization techniques that have been proposed for zzstructures.
This document describes the basic structure of zzstructures and a simple way of visualizing them. It is partly a compilation of information found in other documents, and partly a rephrasing of previous descriptions of zzstructures. Unlike other introductions [15,27] to zzstructures, this document describes zzstructures as a kind of graph (specifically, a directed multigraph with coloured edges) and compares them to other kinds of graphs (multitrees [3] and polyarchies [7,8,9]). The hope is that by explaining concepts with standard graph theory terminology, this document might enable zzstructures to be more widely and better understood by computer scientists.
Apart from trying to make zzstructure concepts more accessible and easier to understand, this document also contains some minor original contributions, which may have been anticipated by Nelson or others. First, the display of "incidental edges" and elisions in Figure 8. (These, or similar or better features, may already be supported by Gzz [24] -- a software package which I have not yet played with. Also, slide 16 of [23] alludes to indicating when cells are connected or not connected to other cells which may or may not be visible.) Second, I propose H+- and I+-views in Figure 9. Third, the classification in Figure 18 is, to my knowledge, the first taxonomy to compare zzstructures with multitrees, polyarchies, and other structures. Fourth, the last section of this document identifies some open problems and areas for future work in zzstructures.
2.1. A graph-oriented definition
A brief review of some standard graph terminology (see Cormen et al. [1] for an excellent introduction):
A graph is an ordered pair G=(V,E) of a set V of nodes (or vertices) and a set E of edges (or arcs). Each edge is a pair of nodes. Graphically, the nodes of a graph may be embedded in a 2D space, and the edges between nodes may be represented as straight or curved line segments connecting nodes.
A directed graph, or digraph, is a graph where the edges are ordered pairs of nodes, i.e. E is a subset of VxV. Hence, each edge can be thought of as a one-way connection from one node to another. Graphically, this is represented by drawing arrow heads on edges.
A multigraph is a graph where E is a multiset, i.e. there are potentially multiple instances of edges between identical pairs of nodes.
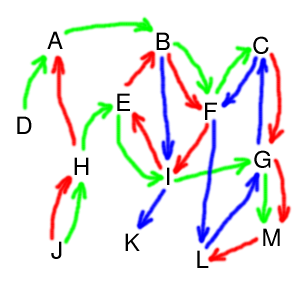
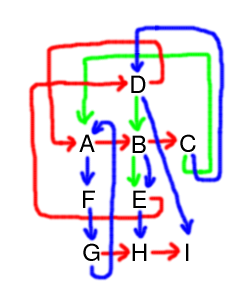
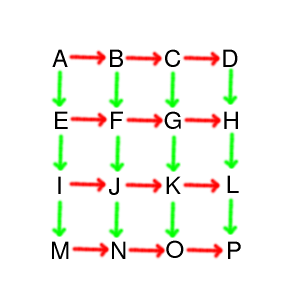
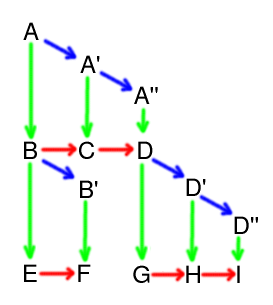
Zzstructures are a kind of directed multigraph, where the edges are coloured or typed (i.e. each edge has a colour or type associated with it), and are subject to the following restriction:
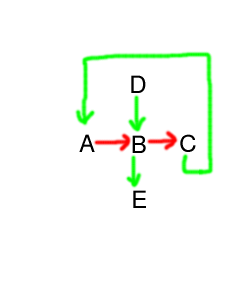
Thus, if red and blue are edge colours, then each node in a zzstructure may have 0 or 1 incoming red edges, 0 or 1 incoming blue edges, 0 or 1 outgoing red edges, and 0 or 1 outgoing blue edges.Restriction R: each node in a zzstructure may have at most one incoming edge of each colour, and at most one outgoing edge of each colour.
Because of restriction R, the edges of common colours in a zzstructure form non-branching, non-intersecting paths and/or cycles within the graph. Because each node has at most one incoming and one outgoing edge of each colour, there is a unique way to move backward or forward along the path of each colour through that node.
|
|
|
|
|
Note that, in the present depictions of zzstructures, one-way arrows are used to represent the edges or "links" in the structure. This follows the conventional representation of digraphs. This is not, however, intended to suggest that the links can only be traversed in one direction, nor that the zzstructure should be implemented with one-way pointers. Indeed, as should become clear, links in zzstructures should be traversable in either direction.
2.2. A list-oriented interpretation
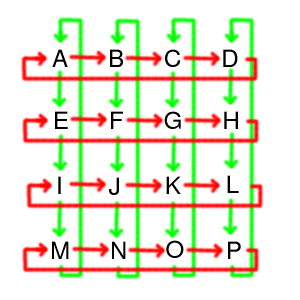
One way to think of a zzstructure is as a set of nodes together with a set of lists of nodes. Each list has a corresponding (not necessarily unique) colour associated with it, and each node may appear in at most one list of each colour. Thus, each list gives the nodes forming a path or cycle whose edges are of the list's colour.
The zzstructure in Figure 1 could be described with the following lists. We prefix each list with its colour.
Each list corresponds to what Nelson calls a rank of cells [16]. Ranks may be traversed in a posward (with the directed edges) or negward (against the directed edges) direction [18]. If the rank is not a cycle (i.e. not a ringrank [21]), then it has a negward-most cell called the headcell [21].
Indeed, according to [27],
"A slightly different way of looking at the structure that may sometimes helps thinking about it is to consider dimensions as {\em labeled lists} of cells. That is, instead of considering cells and connections, consider lists (each list labeled with a string) of cells where the same cell may be on several lists (but only one with any given label). It is not difficult to see that this is exactly the same structure as above but viewed from a different angle: emphasizing the ranks instead of the single cell and its connections."Here, each "label" is an edge colour.
Nelson claims [14] that zzstructures are a generalization of his 1965 zipper lists [4].
See Dave et al. [2] for an example of related work in path-centric browsing.
Note that zzstructures could be equivalently defined as a kind of hypergraph [1], where each hyperedge corresponds to one list (or rank), and each hyperedge is an ordered tuple of nodes, and hyperedges of the same colour may not intersect.
2.3. A space-oriented interpretation
Let N be the number of edge colours in a zzstructure Z. We can think of Z being embedded in an N-dimensional manifold, where each edge colour corresponds to a different spatial dimension. Thus, travelling from a node to an adjacent node along an edge of colour C corresponds to moving through the manifold along the direction corresponding to dimension C. The edges in a zzstructure can act as "wormholes" that "teleport" someone traversing the structure to arbitrary nodes. Thus, the manifold in which the zzstructure is embedded is not, in general, Euclidean.
Perhaps not surprisingly, other generic names that have been proposed for ZigZag are "zzspace" and "quantum hyperspace" [15].
2.4. Other descriptions of zzstructures
Analogies used to describe zigzag:
"The ZigZag system [...] resembles [...] perhaps a spreadsheet cut into strips and glued into loops." [15]
"It's best compared to beads on a string: every cell is like a bead with many holes, and you can put one string of any color (dimension) through each bead." [14]
"there is no way I can explain it other than with this visualization: imagine tiny cells of addressable information existing in a large container. Then, imagine taking needle and thread and stitching together into a string (a dimension!) whatever cells you like. Then imagine another dimension stitching together more cells (and some of those already captured in another dimension). Do this for a while and you have a massive, multidimensional representation of whatever those cells are about." -- http://xanadu.com.au/mail/zzdev/msg01566.html
The last two analogies are appropriate, so long as one keeps in mind that there may be multiple strings of each colour (i.e. multiple ranks along each dimension), but at most one string of each colour may pass through a given bead or cell (i.e. each cell appears in at most one rank along each dimension).
In keeping with the analogy of tangled strings or threads, one can imagine choosing a single thread, and straightening it by pulling it taut. The effect would be to "flatten" the structure along one rank. By successively straightening different threads, one may obtain very different rearrangements of the nodes.
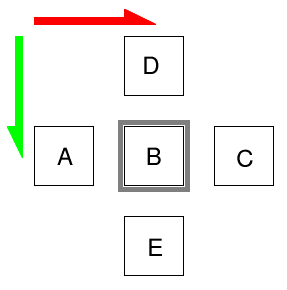
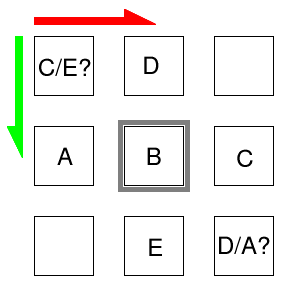
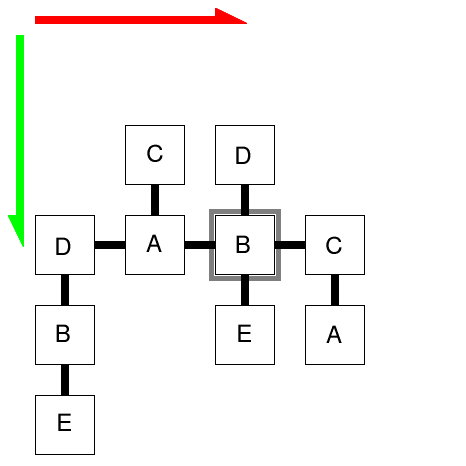
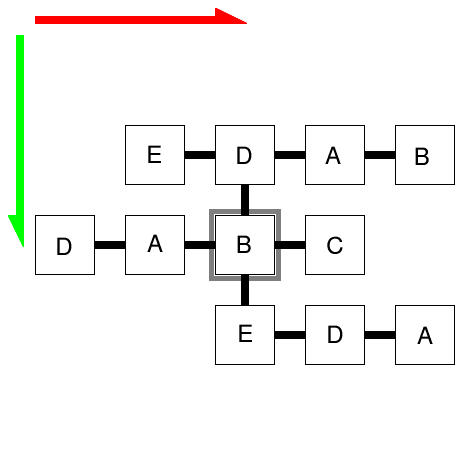
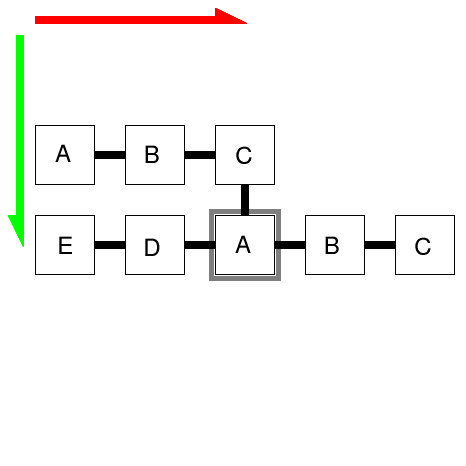
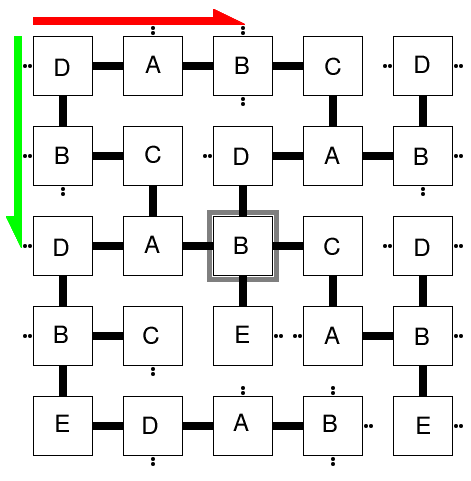
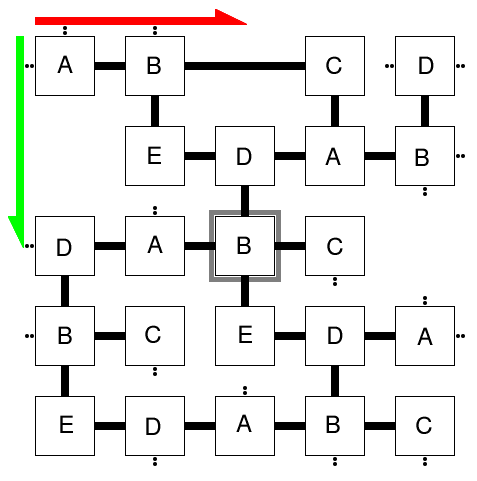
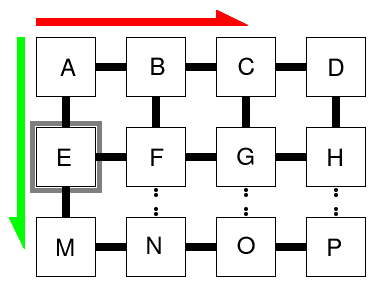
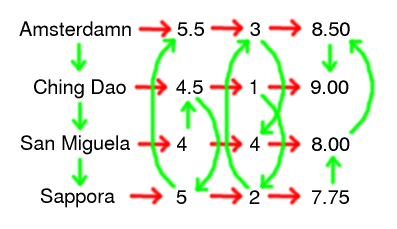
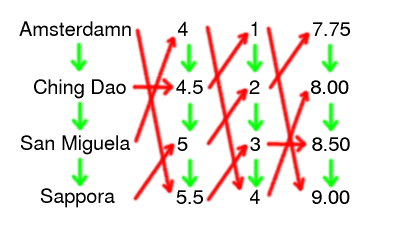
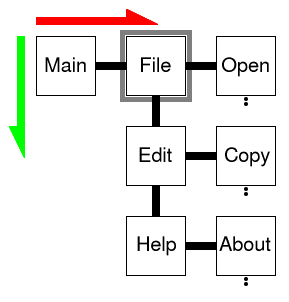
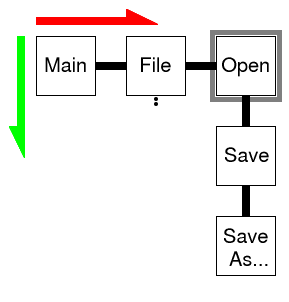
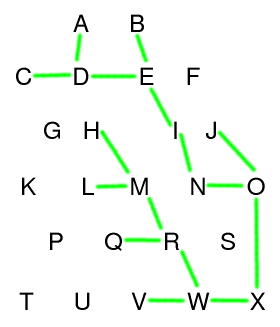
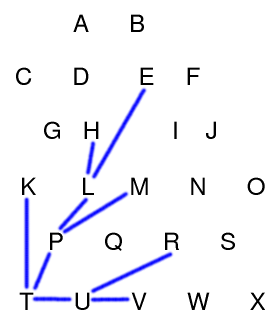
Zzstructures can, in general, be very large and complicated, having many nodes and dimensions (edge colours). This makes it difficult to draw them in a clearly understandable way. One strategy for drawing is to pick a single node as a focal point, and draw the neighbourhood around that node. Nelson [14,17] describes a 2D cursor-centric viewing scheme that makes use of 2 spatial dimensions at a time, and locally "flattens" a subset of the neighbourhood around a cursor (i.e. a selected node). More specifically: we find the subset of nodes that are connected to the cursor's node via edges along the two chosen dimensions. This subset of nodes can be embedded in a (non-Euclidean) 2D manifold, which is then displayed in a flat, 2D view. Wormholes are handled, in part, by displaying virtual copies of nodes. By changing the chosen pair of dimensions, we can visually reveal, hide, and rearrange nodes in interesting ways (see Nelson [14] for a step-by-step example). Multiple arrangements (lists, 2D arrays, trees, ...) can co-exist by using different dimensions to encode each arrangement.
The 2D cursor-centric view is perhaps the earliest or most basic drawing scheme that has been proposed for zzstructures, and detailed examples of it are given below. Other, more sophisticated visualizations, such as a "vanishing" view, have been implemented and are described at [26,27].
The examples in this section are somewhat contrived. The graphs have only 5 to 9 nodes, whereas most of the 2D views have room for 5x5=25 nodes, which is more than enough to show the entire graph. Thus, there is much redundancy in many of the 2D views. These examples were of course chosen to be as simple as possible and still illustrate the desired concepts. Keep in mind that, in practice, the zzstructure being viewed may be very large, and there is usually not enough room in the 2D view for all of the nodes.
| 
| 
|
| 
|

| 
|
|
| 
| 
|
|
| 
| 
|
| 
|
|
|
| 
|
|
| 
| 
|
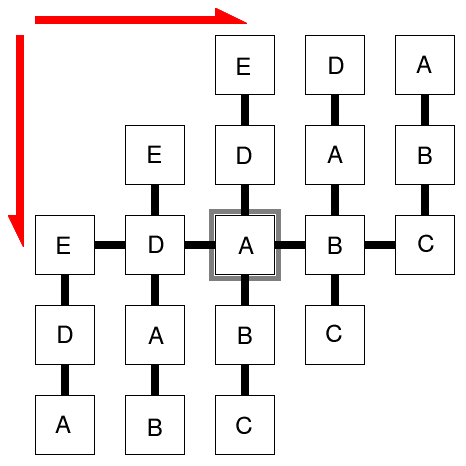
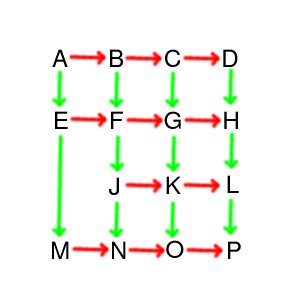
Nelson states [16,19] that zzstructures generalize lists, cycles, tables (a.k.a. grids, spreadsheets, or 2D arrays), and trees. In the below examples, we illustrate these and other cases.
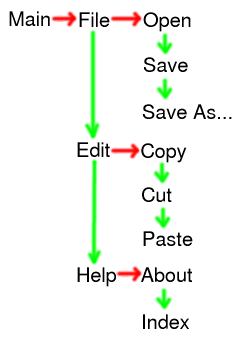
Keep in mind that zzstructures also support any simultaneous combination of the below structures, since each substructure can be encoded using different colours. For example, a set of nodes corresponding to files could be organized in a list using one dimension, and in a 2D tabular grid using two other dimensions, and in a tree using additional dimensions. Mapping different dimensions to the 2D view allows the user to rearrange the nodes and see each substructure.
| 
| 
| 
|
| 
|
| 
|
| 
| 
|
| 
| 
| 
|
|
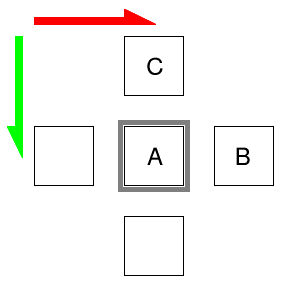
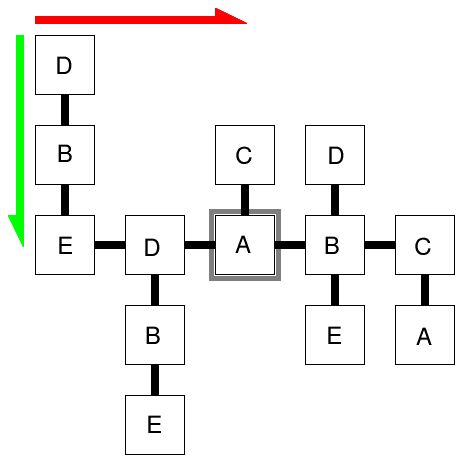
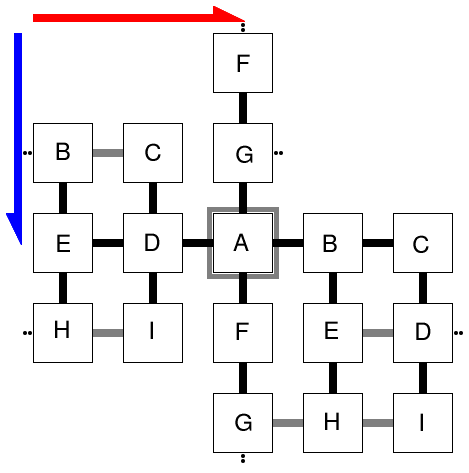
As already shown in Figures 11, 12, and 14, the nodes of a zzstructure can be revealed, hidden, or visually rearranged in interesting ways by moving the cursor or by changing the type of view in effect (e.g. changing an H-view to an I-view). Another action used when navigating a zzstructure is to change the pair of dimensions mapped to the 2D view (e.g. Figure 8, or see Nelson [14] for a step-by-step example). As already mentioned, multiple arrangements (lists, 2D arrays, trees, ...) can co-exist in a zzstructure by using different dimensions to encode each arrangement. Each arrangement is then accessible by mapping the appropriate dimensions to the 2D view.
"ZigZag allows you to arrange the same things into different traditional structures" [27]
The ability of zzstructures to encode multiple arrangements comes essentially from having edges that are coloured, allowing each edge to be marked as belonging to one arrangement or another.
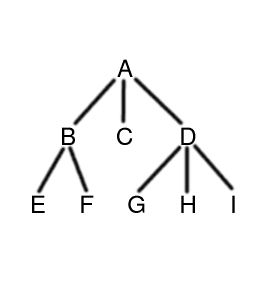
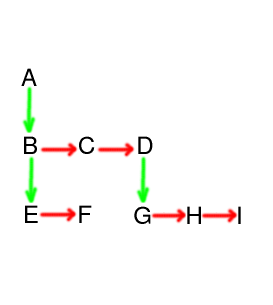
"Having dimensions is essential to having any structure in the space: they allow us to build substructures. In a generic graph you can't define easily how for example lists or hierarchies can be represented. In ZigZag it's easy: a list is a rank along a dimension, and hierarchies are composed by having a cell's children on a rank along one dimension and connecting the rank (ie. the headcell of the rank) to the parent along another dimension.This makes zzstructures more powerful and more general than graphs with untyped edges. In particular, zzstructures are more general than multitrees [3], and even more general than polyarchies [7,8,9].Since dimensions allow substructuring, they also allow building custom views. The tree view [...] is a good example: it renders the hierarchical substructure mentioned above as a nice tree. The presentation view [...] is another, possibly better example." -- http://www.advogato.org/article/156.html
| 
|
| 
| 
| 
|
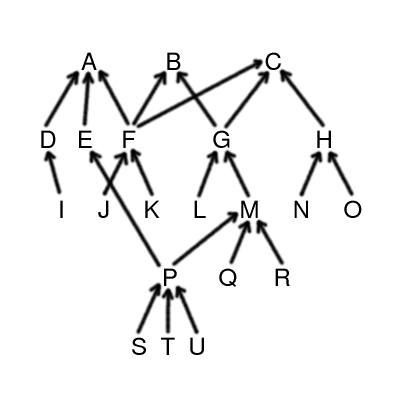
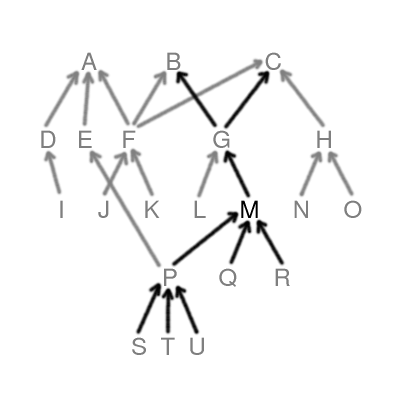
Robertson et al. claim that multitrees are a subset of polyarchies ("MultiTrees are multiple hierarchies with shared subtrees. But polyarchies are multiple intersecting hierarchies, sharing at least one node rather than sharing subtrees. Hence, MultiTrees are a subset of polyarchies." [8 and 9]). This is roughly true, since the trees in a multitree may only share subtrees, whereas the trees in a polyarchy may share arbitrary nodes. However, as seen in this section, multitrees are a kind of directed graph that have no need for coloured edges, because the trees in them are implied by the multitree's structure. Polyarchies, on the other hand, must have their trees explicitly marked, and so are conveniently defined as a kind of (directed or undirected) multigraph with coloured edges. Since these are different kinds of objects, multitrees are not technically a subset of polyarchies. However, the information contained in a multitree can always be encoded with a polyarchy, and in this sense polyarchies do generalize multitrees.
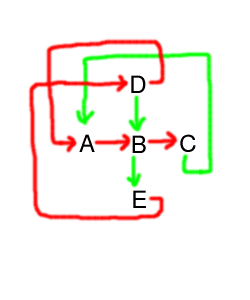
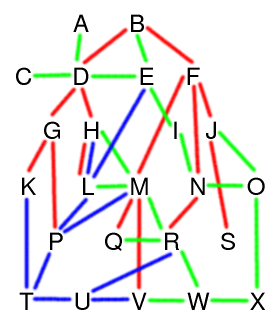
Both multitrees and polyarchies (as defined here) make use of many-to-one links between nodes, which are not allowed in zzstructures. However, Figure 13 shows how many-to-one links, and hence trees, can be "simulated" or encoded in zzstructures, by using additional colours. It follows that the information contained in a multitree or polyarchy can always be encoded with a zzstructure. In addition, and unlike multitrees or polyarchies, zzstructures may contain arbitrary lists, tabular grids, trees, and other structures, all simultaneously.
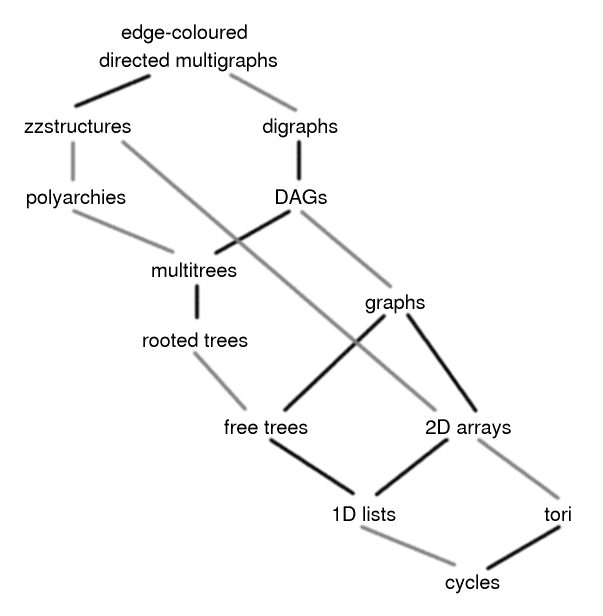
|
It is apparent from Figure 18 that we could generalize zzstructures by removing restriction R, thus allowing all edge-coloured directed multigraphs. Such structures would have the same ability as zzstructures to encode multiple, overlapping substructures, and would also afford many-to-one links using a single edge colour. Is there any value in having restriction R ?
Restriction R requires that each node have at most one incoming and one outgoing edge of each colour. As pointed out earlier, this implies that there is a unique way to move backward or forward along the path of each colour through a node. This makes it more natural to think of the links as "2-way" links: if a user arrives at a given node from a given direction, returning to the previous node is simply a matter of moving back in the opposite direction. This would not be the case with many-to-one links, where a user could arrive at the same node via the same direction from many different previous nodes. With restriction R, backing-up along an edge requires only remembering which colour was traversed. Without restriction R, backing-up requires remembering which node the user came from.
In addition, and perhaps more importantly, having many-to-one links of a single colour would make 2D viewing more problematic: in general, a node might have multiple nodes to its immediate "right" and immediate "left". The 2D cursor-centric views described in this document would not apply without adjustment. In fact, the whole spatial interpretation of zzstructures -- of edge colours as dimensions -- would seem less appropriate. Thus, there is definite value in the constraints imposed by restriction R.
Below are some open issues which occurred to me while preparing this document. I am not aware of how much work has already been done by Nelson or others to address these or other issues.
Since zzstructures subsume polyarchies, clearly files could be organized according to one or more traditional hierarchical trees. However, would it make sense to have, for example, two distinct trees that each cover the entire set of files on one's harddrive ? What if these two trees are mostly identical, and only differ in small, localized regions ? Would having multiple trees create more work for the user, since each new file might have to be explicitly added to multiple trees ?
How can zzstructures best solve the common problem of users wanting to place a new file in multiple "folders" ? By cloning the file along a special clone dimension, and then placing each clone under a different parent node ? Or, are "folders" (i.e. trees) not the best model to use ?
Figure 12 suggests how a set of data might be resorted by any column of data. However, if a user wants to sort data or files by multiple keys (e.g. first by type, and then by size; or, in the case of academic papers, perhaps first by conference name, then by year, then by author), it's less clear how a zzstructure might elegantly support this without a custom viewing scheme, or special support for dynamically regenerating links to resort files.
    @book{cormen,
      author={T. H. Cormen and C. E. Leiserson and R. L. Rivest},
      title={Introduction to Algorithms},
      year=1990
    }
    @inproceedings{dave2003,
     author = {Pratik Dave and Unmil P. Karadkar and Richard Furuta
        and Luis Francisco-Revilla and Frank Shipman and
        Suvendu Dash and Zubin Dalal},
     title = {Browsing intricately interconnected paths},
     booktitle = {Proceedings of the fourteenth ACM conference
                on Hypertext and hypermedia},
     year = 2003,
     pages = {95--103}
    }
    @inproceedings{furnas1994,
     author = {George W. Furnas and Jeff Zacks},
     title = {Multitrees: enriching and reusing hierarchical structure},
     booktitle = {Proceedings of ACM CHI 1994 Conference on Human Factors in Computing Systems},
     year = 1994,
     pages = {330--336}
    }
    @inproceedings{nelson1965a,
      author = {Theodor H. Nelson},
      title = {A File Structure for the Complex,
             the Changing and the Indeterminate},
      booktitle = {Proceedings of ACM National Conference},
      year = 1965
    }
    @article{nelson1999a,
     author = {Theodor Holm Nelson},
     title = {Xanalogical structure, needed now more than ever:
          parallel documents, deep links to content, deep versioning,
          and deep re-use},
     journal = {ACM Computing Surveys},
     year = {1999},
     month = {December},
     volume = {31},
     number = {4es},
     pages = {33},
     publisher = {ACM Press}
    }
    @inproceedings{nelson2001a,
     author = {Theodor Holm Nelson},
     title = {ZigZag (Tech briefing)},
     booktitle = {Proceedings of ACM conference on Hypertext and Hypermedia},
     year = 2001,
     pages = {261--262}
    }
    @inproceedings{robertson2000a,
     author = {George Robertson},
     title = {From hierarchies to polyarchies: visualizing multiple relationships},
     booktitle = {Proceedings of ACM AVI 2000 working conference on Advanced visual interfaces},
     year = 2000,
     pages = {13},
     location = {Palermo, Italy},
     doi = {http://doi.acm.org/10.1145/345513.345230}
    }
    @inproceedings{robertson2002a,
     author = {George Robertson and Kim Cameron and Mary Czerwinski and Daniel Robbins},
     title = {Polyarchy visualization: visualizing multiple intersecting hierarchies},
     booktitle = {Proceedings of ACM CHI 2002 Conference on Human Factors in Computing Systems},
     year = 2002,
     pages = {423--430}
    }
    @article{robertson2002b,
      author = {George Robertson and Kim Cameron and Mary Czerwinski and Daniel Robbins},
      title = {Animated visualization of multiple intersecting hierarchies},
      journal = {Information Visualization},
      year = 2002,
      month = {March},
      volume = 1,
      number = 1,
      pages = {50--65},
      publisher = {Palgrave Macmillan Ltd.},
    }
(This section added June 2004)
After this document was pretty much finalized and published on the web, on 13 Jan 2004, I emailed Ted Nelson asking him to look at it. He wrote back, and offered answers to some of the "Open Issuse" in section 6. Below is my subsequent response, dated 22 Jan 2004, where I quote parts of his message.
> First, I am greatly honored by such a respectable analysis of the system.
> (Barbara Simons, past president of the ACM, has said she thinks ZigZag can
> be analyzed in graph-structure terms, and you are doing just that.)
>
> On a quick reading, I am hugely impressed and pleased that you've done
> this.

I'm glad to hear you seem to approve, on the whole.
I still don't feel like I fully appreciate ZigZag,
but what little I do understand, I find intriguing
enough that I think it's important to keep accurate,
detailed, and clear records of whatever ZigZag designs we can,
for posterity.  So getting approval from the originator
of ZigZag is quite desirable.


> My one question is why you use one-way arrows for your links, when all
> zzstructure links are inherently symmetrical?  I recognize that this is the
> graph-structure tradition, but some might find it misleading.

Indeed, I am following graph theory conventions with the one-way arrows.
The arrows are useful for differentiating posward from negward
directions.
I do not, however, mean that the links can only be traversed
in one direction, nor that the zzstructure must be implemented
with one-way pointers.  I'll probably add a note to my tutorial
to clarify this, once I find some more time to work on it.


> In any case, thank you ever so much for doing this work.
>
> ===A quick stab at your key questions--
>
>         - If a user has a large set of data stored in a zzstructure,
> involving
> many different dimensions, might the management of a large set of
> dimensions become a problem ?
>
>                 Ans.  Rather than write essays about this, I intend to put
> my answer into
> a product.  Also users may try their own solutions.
>
>         - What's the best way to visualize zzstructures on a 2D screen ?
> How can
> we make full use of available screen space ?
>
>                 Ans.  There are no determinate answers here.  But "full
> use" is really
> about responsiveness, not about static views.

Very well put.


> I want to get video-game
> performance out of this puppy.  We're currently developing in OpenGL.  (See
> the Windows prototype.)
>
>         - With traditional hierarchical trees, if a user wants to do an
> exhaustive
> visual search for something ... [Visual? /tn]...

By "visual search", I mean doing it manually, at the user's pace,
e.g. on linux this might correspond to doing "ls", "cd folder_name",
"ls", "cd ..", etc.  In this way, the user can exhaustively explore
a (smallish) subtree, and be sure that they encounter every file
exactly once.


> However, with
> zzstructures, as with even simple graphs, there doesn't seem to be any
> straight-forward traversal that will visit every node once and be easy to
> keep track of. Might nodes become lost or forgotten ... ?
>
>                 Ans.  Good question.  Search applets will require
> experimentation.
> Cataloguing can help (e.g. keeping track of which cells are coplanar.)
>
>         - How might we reveal all the dimensions along which a cell has
> connections...?
>                 Ans.  See Gzz, the beautiful implementation by Tuomas Lukka
> et al.  The
> latest version has a view that shows all a cell's connections.
Later, I received this message from Ted, dated 17 Mar 2004.
Hi Michael--

>I still don't feel like I fully appreciate ZigZag,

This is my impression also.

Here's the new one-liner:

"zzstructure is a new system of representation which generates
 a visible and traversible pseudospace, which has a variety
 of benefits ..."

I think it's very important that you try it interactively,
 still best done with the gzz version.
Later still, I received this message dated 16 May 2004.
Another point-- you asked how do searches--
>By "visual search", I mean doing it manually, at the user's pace,
>e.g. on linux this might correspond to doing "ls", "cd folder_name",
>"ls", "cd ..", etc.  In this way, the user can exhaustively explore
>a (smallish) subtree, and be sure that they encounter every file
>exactly once.
>> However, with
>> zzstructures, as with even simple graphs, there doesn't seem to be any
>> straight-forward traversal that will visit every node once and be easy to
>> keep track of. Might nodes become lost or forgotten ... ?

I didn't say this earlier-- the best thing is to create a View
 that finds all the stuff you want and shows it in ZigZag
 optimally and wonderfully :)
Copyright ( C ) Michael McGuffin, 2004
Substantially written (including Figures 1-17) during December 2003
Published on the web, with revisions (including Figure 18),
during January 2004
Email correspondence section added June 2004